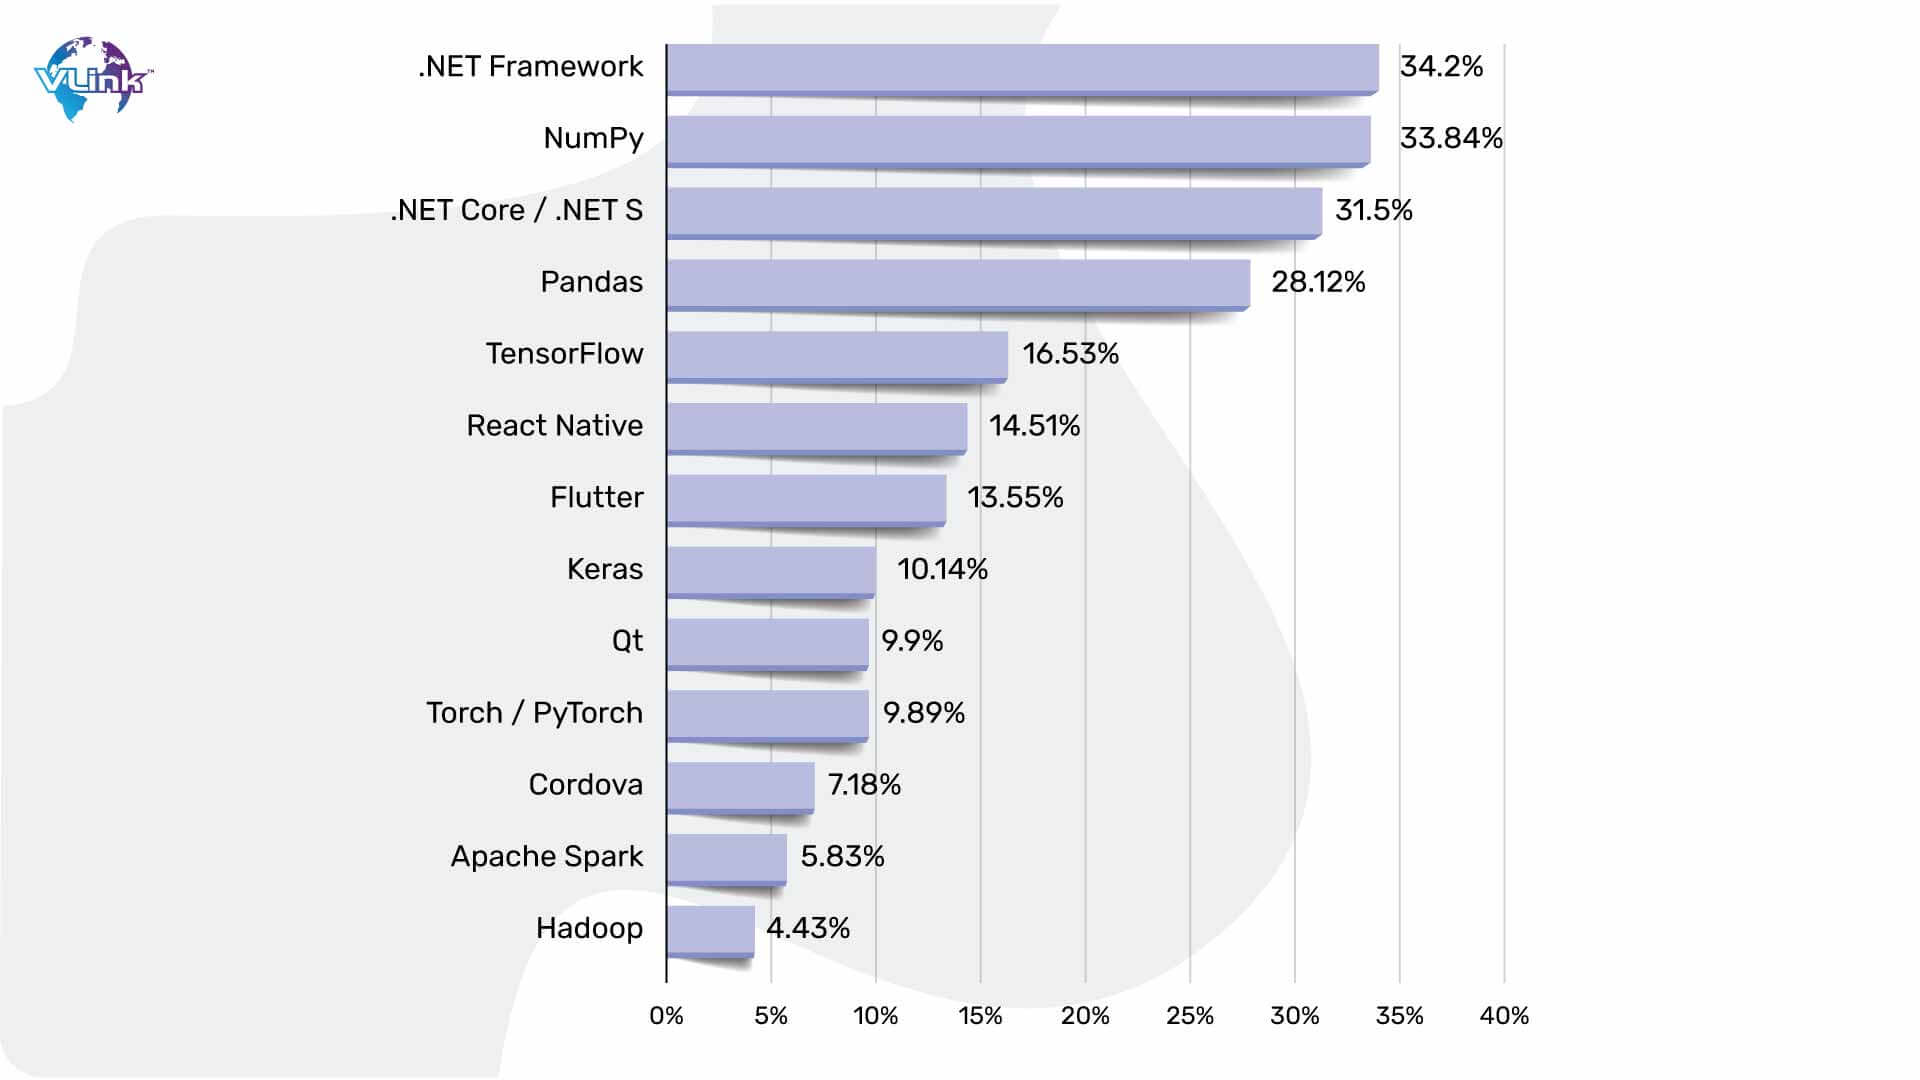
.NET is ruling almost every industry. According to a survey, 34.2 percent of the total websites and web apps are running on the .NET framework, leading the charts of most preferred and utilized development frameworks by Fortune 500 companies.

But sometimes it becomes confusing to understand why your .NET applications are slowing down. This certainly happens due to high CPU usage. Needless to say, if your CPU use is high, your web application will be both slow and challenging to use.
In this blog, we are going to explain how to resolve this issue using .NET. We will explain what causes high CPU use, how to make your application faster with simple steps.
So, let us discover how to fight high CPU usage issues!
Understanding CPU Usage in .NET Applications
CPU usage is critical when it comes to.NET applications as it is used to determine the performance and utilization of multiple programs.
For the uninitiated, high CPU usage results in low response, poor performance, and scalability issues. These significantly impact user satisfaction and retention.
With users today having high expectations and a low tolerance for poor experiences, issues like high CPU usage and CPU load have the potential to ruin a business’s reputation and competitiveness.
There are several ways for companies to benefit from optimizing CPU usage, such as:
- Increased application responsiveness
- Improved ability to scale to meet growing workloads
- Lower infrastructure costs with more efficient use of resources in.NET applications
In short, we will never say understanding and implementing CPU usage in.NET applications should be treated as a technical consideration only. It is, undoubtedly, a strategic need for companies that want to produce excellent digital experiences and stay competitive.
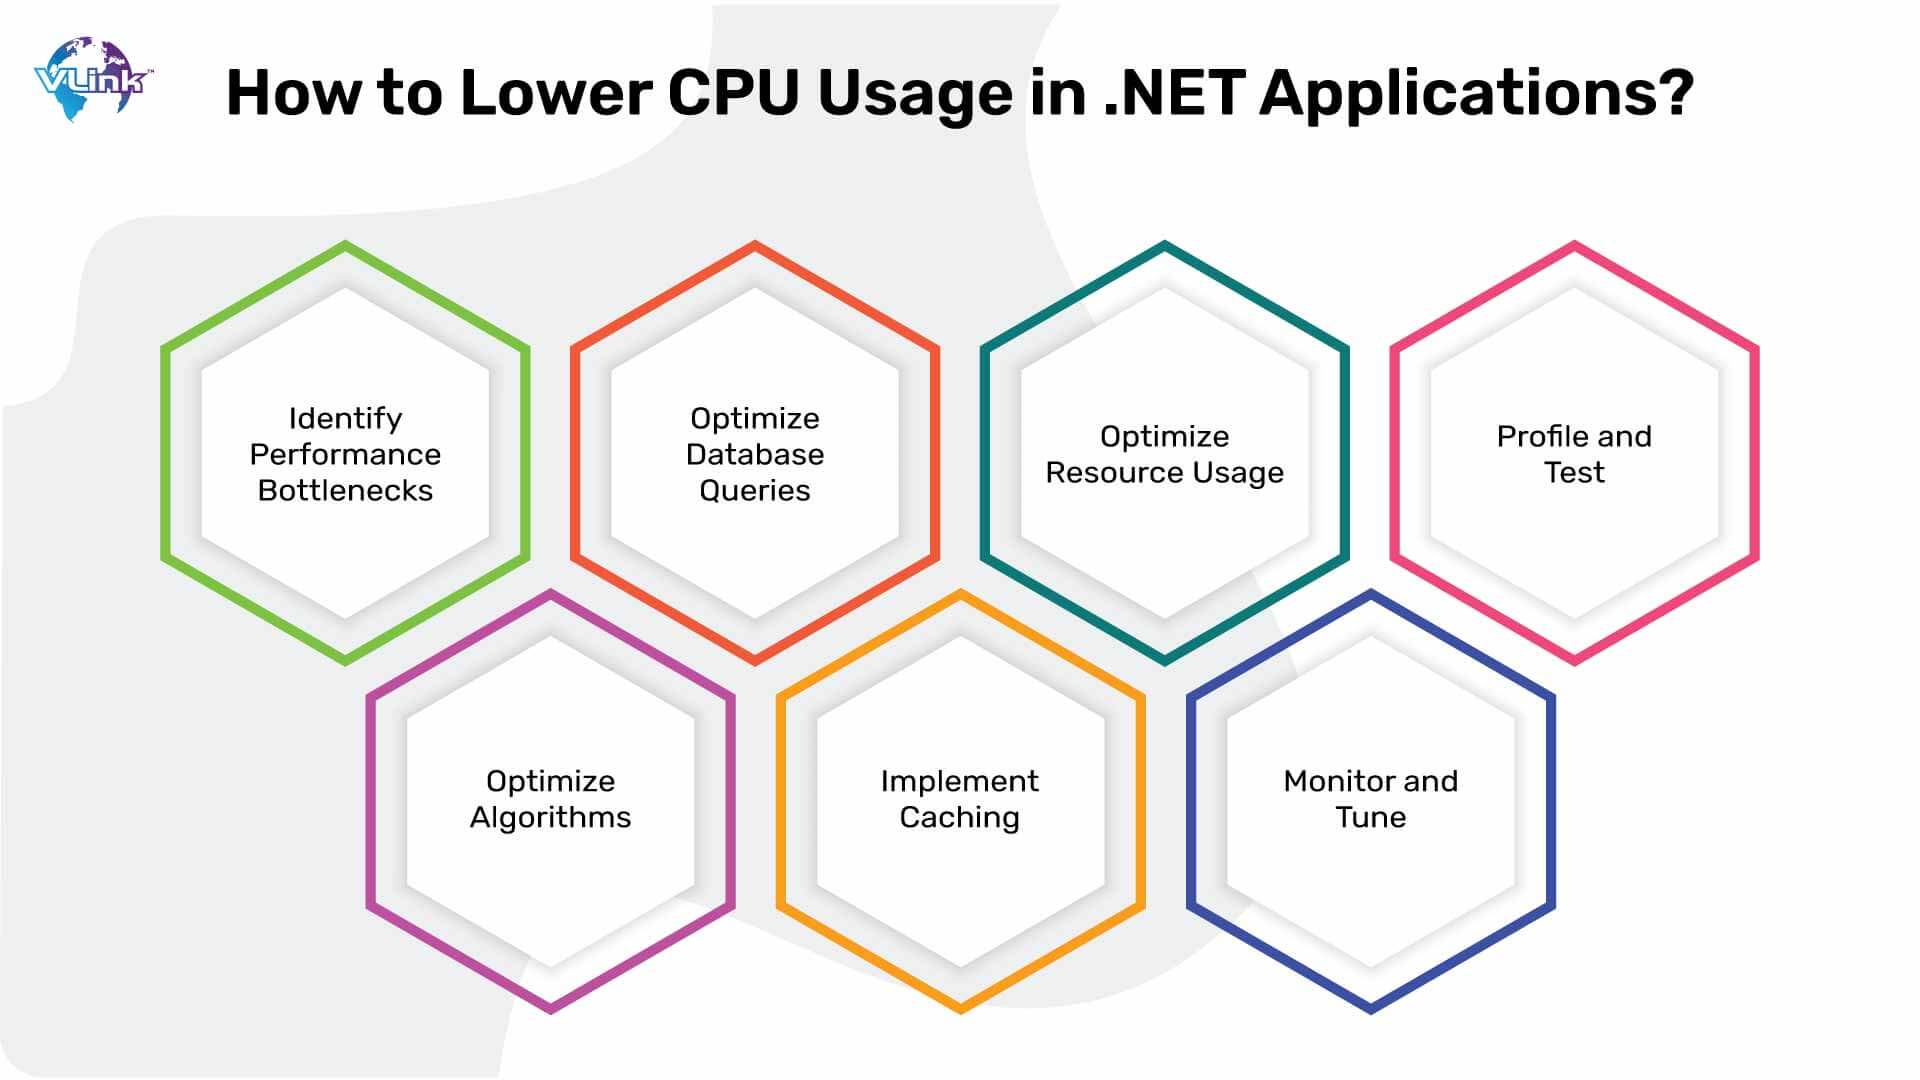
How to Lower CPU Usage in .NET Applications?

Here is a step-to-step guide to lower high CPU Usage in .NET applications:
Identify Performance Bottlenecks
The most effective way of lowering high CPU usage in.NET applications is to first identify the performance bottlenecks through profiling.
Profiling tools such as Visual Studio Profiler and JetBrains dot Trace can be used to analyze the application’s performance and identify which areas of code are utilizing more CPU.
Profiling the application’s CPU utilization over time enables developers to identify patterns and trends that help prioritize areas that require optimization.
Optimize Code
Code optimization is an essential activity to decrease CPU usage in .NET applications. So, developers must analyze the algorithms applied in the critical sections of code performance to refactor them to reduce the computational complexity and alternatives to implement.
Here’s an example:
Below is a normal code that can use high CPU usage:
d using System; namespace HighCPUUsageExample { class Program { static void Main(string[] args) { // Example of a task with high CPU usage for (int i = 0; i < 1000000; i++) { // Some computation-intensive task double result = Math.Sqrt(i) * Math.Pow(i, 2) / Math.Log(i + 1); } } } } In this scenario, we have a loop that performs a computation-intensive task repeatedly. This task involves mathematical operations that consume CPU resources.
Now, look at this optimized code:
using System; using System.Threading; namespace LowerCPUUsageExample { class Program { static void Main(string[] args) { // Example of the same task with lower CPU usage for (int i = 0; i < 1000000; i++) { // Introduce a small delay to reduce CPU usage Thread.Sleep(1); // Some computation-intensive task double result = Math.Sqrt(i) * Math.Pow(i, 2) / Math.Log(i + 1); } } } } In this code, we have optimized the code by introducing a small delay using Thread.Sleep(1) inside the loop. This allows the CPU to rest for a short period between iterations, thereby cutting down overall CPU usage while still completing the task. This approach is useful when the task doesn't require real-time processing and can tolerate slight delays.
In essence, creating better performance characteristic codes and refactoring old ones can help reduce CPU usage and lift the entire application’s performance.
Optimize Database Queries
Unoptimized database queries are another common reason for high CPU usage of.NET applications. To address this issue, developers need to check the database queries that their app executes and determine CPU-intensive database operations. Most of the programmers resolve this issue by creating appropriate indexes, eliminating excessive joins, and minimizing the amount of retrieved data.
Implement Caching
Developers can take advantage of caching to eliminate the need for CPU-intensive database requests or computations of data that is frequently accessed.
There are several caching approaches, such as in-memory caching and distributed caching, that developers may use to efficiently cache data to avoid unnecessary CPU usage.
Developers can also improve CPU usage and overall application performance by setting cache eviction policies and maintaining data up to date.
Monitor and Tune
Developers can rely on efficient performance monitoring tools and integrate an application performance monitoring solution to follow CPU usage, as well as establish an alert for sudden spikes of CPU usage or performance gradients. We have talked about some effective tools to analyze CPU usage in the next section.
Such tools enable developers to calibrate optimization strategies based on monitoring data and performance indicators to ensure ongoing peak performance.
Profile and Test
Constantly profiling the application allows developers to find new performance bottlenecks and cases to optimize. Performance testing also checks and confirms the efforts made to optimize and prevent new performance bottlenecks or previous bottlenecks. Load testing, in particular, allows the developers to understand how well their application scales and under what conditions the application can be optimal and efficient for the specified workloads.

Is CPU Usage and CPU Load the Same?
CPU Usage and CPU Load are mistaken to be the same, but they are entirely two different aspects of CPU performance.
If we talk about CPU Usage, it is the percentage of computational resources the CPU is using at a given time to execute tasks. In simpler words, it tells you the exact workload the CPU is managing relative to its maximum capacity.
CPU Load, on the other hand, represents the total number of tasks actively running on the CPU or waiting to be executed. This means, it helps you understand the demand placed on the CPU.
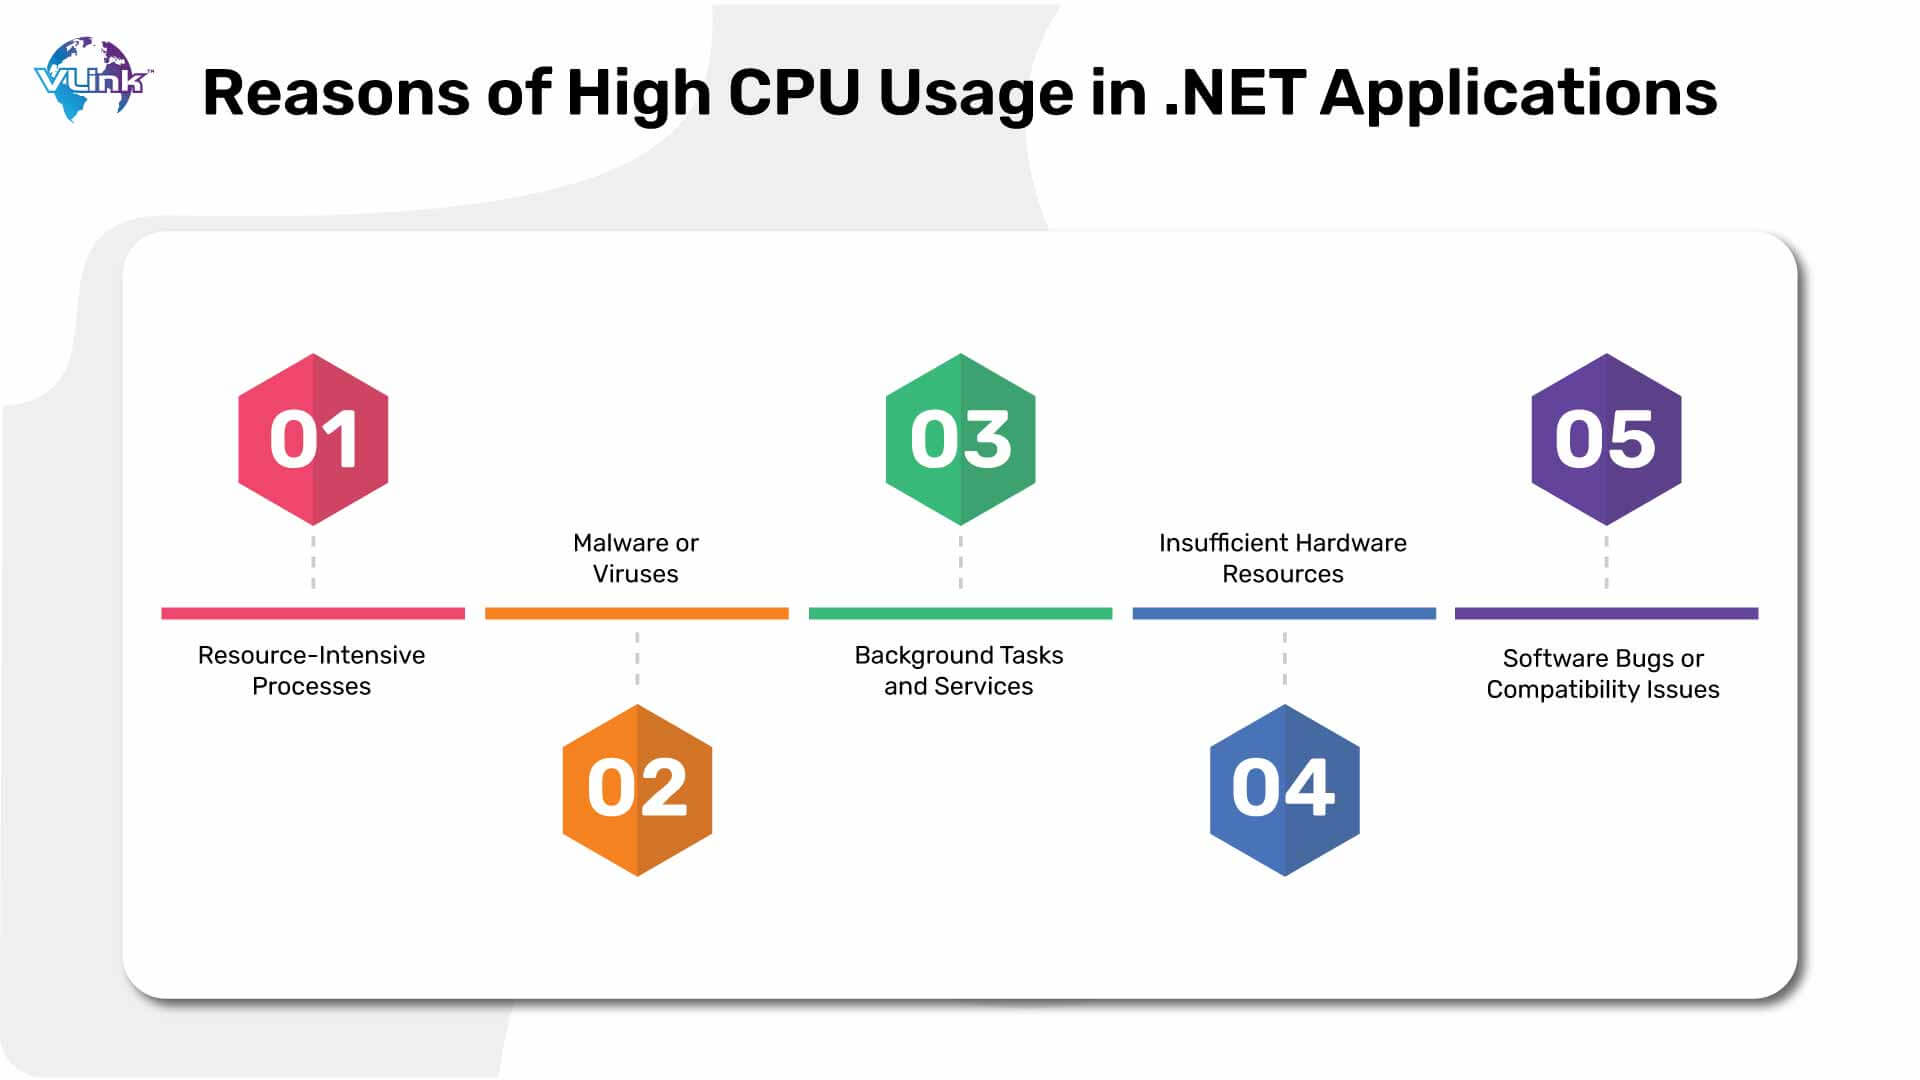
Identifying Reasons of High CPU Usage in .NET Applications

Here are some common reasons of high CPU usage in .NET applications:
Resource-Intensive Processes
Some applications and processes consume high CPU resources, and the problems are associated with inefficient coding practices which are primarily the result of a poorly designed algorithm, unbounded loops, or a larger amount of memory used.
A memory leak, for instance, is one of the issues that could lead to excessive CPU over time, as the system may struggle to create more allocations within the available memory when the existing allocation is that memory is not fully released.
Malware or Viruses
Malicious software such as viruses and trojans may take over system resources, including CPU cycles, to perform certain activities without the user’s knowledge. For example, a common cryptocurrency mining malware uses a system’s CPU to mine for the attacker’s cryptocurrency or host botnets that form many exploited systems to conduct distributed denial-of-service attacks. It is also equally important to keep a check on the biggest cybersecurity threats.
Background Tasks and Services
System maintenance activities, such as software updates, antivirus scans, or scheduled backups, can temporarily take up a fraction of the CPU during the execution process. This is seen usually if background services are misconfigured or poorly optimized.
Lack of Hardware Resources
If the hardware resources are inadequate, say for example, if the CPU is underpowered, RAM is insufficient, or the storage devices are slow, it may bottleneck system performance and leads to high CPU usage. As a result, resource-intensive activities may not be executed efficiently when the hardware resources are inadequate to fulfill the workload.
Software Bugs or Compatibility Issues
Software bugs such as memory leaks, infinite loops, or race conditions can also result in higher usage of CPU. This happens due to the compatibility difficulties among components of software. Also, when software versions are so old, it may lack performance optimization and technical workarounds, increasing the risk of high CPU issues.
Analyzing Tools for High CPU Usage
You can troubleshoot high CPU usage only when you analyze it and understand its actual real-time performance.
So, here are tools that can help you analyze the CPU usage:
Task Manager
In Task Manager, open the CPU consumption to find the process or application that’s causing high CPU usage:
Select Start, type task, and then in the search results, select Task Manager.
By default, the Task Manager window is open on the Processes tab. If a single list of process names appears in the Name column, you can expand any instances of grouped processes.
Click the CPU column header, in the opened list click the CPU to sort the list by the CPU usage. Then, make sure that the arrow on the header points down to sort the data from the greatest CPU consumption to the least.
If the process can be stopped, or any service related can be turned off – stop the process or the service and check if this helps.
Profiler
While monitoring high CPU usage, you need some diagnostics tool that can give you an idea of what the code is doing. The most obvious choice is a profiler.
There are multiple profilers to choose from. On all operating systems, dotnet-trace can be used, but due to the limitations such as safe-point bias and managed-only callstack, it will generally give you more general information compared to a kernel-aware profiler such as ‘perf’ for Linux and ETW for Windows.
If your investigation is only about managed code, then you can just rely on dotnet-trace.
Visual Studio
Here’s how you can analyze high CPU usage using visual studio:
First things first, open the project in Visual Studio that you plan to debug. Then move to the source code of your app and set a breakpoint where you wish to check CPU usage.
Then, set another breakpoint at the end of the function/region of the code that you want to analyze. By setting two breakpoints, you will be able to only collect data from the code parts you are actually interested in.
The Diagnostic Tools windows appear automatically, unless you have turned it off. To make the window appear again, click Debug > Windows > Show Diagnostic Tools.
You can choose to see CPU Usage, Memory Usage or both, using the Select Tools setting on the toolbar. Also, if you are using the Visual Studio Enterprise, you can also enable or disable IntelliTrace in Tools > Options > IntelliTrace.
Click Debug > Start Debugging. When the app finishes loading, the Summary view of the Diagnostics Tools will appear. If you need to open this window, click Debug > Windows > Show Diagnostic Tools.
Run the scenario that will result in your first breakpoint being hit.
While the debugger is paused, turn on the collection of the CPU Usage data and open the CPU Usage tab. After you choose Record CPU Profile, Visual Studio starts recording your functions and the time it took to execute. You will be able to view the collected data, and only if your app is stopped at a breakpoint.
Click F5 to run the app to your second breakpoint. You now have performance data for your application, in particular, the code region between two of your breakpoints that runs there. The profiler starts preparing thread data. Just give it a second to finish. The CPU usage tool will now display the CPU usage report to you.
If you wish to choose a more specific part of code to monitor, choose a region in the CPU timeline. At this moment, you can start to monitor the data. If you face any issue collecting or displaying data, see Troubleshoot profiling errors and fix issues.
To make things easier, you can rely on a dedicated .NET developer who has a comprehensive idea of the tools listed above. It is always a smart idea to hire dot net developers at fixed cost.

Hire Dot NET Developers with VLink & Keep Your CPU Usage in Check
Hire expert Dot NET developers with VLink. Our developers possess years of expertise in building high-quality and high-performance .NET solutions that are appropriate for your company needs.
Plus, with in-depth expertise in profiling, monitoring, and optimizing CPU consumption in .NET applications, our developers can improve your efficiency by identifying and eliminating performance bottlenecks.
So, do not wait any longer and contact VLink and hire experienced dot NET developers now to supercharge your .NET applications!


 Shivisha Patel


