The pace of digital transformation has never been faster. For US and Canadian enterprises, the pivot to hybrid and multi cloud observability platforms is no longer an option—it’s the foundation of business agility. As organizations aggressively pursue modernization of legacy systems, observability, and containerization of workloads on platforms like Kubernetes and Docker, the complexity of the modern IT stack has increased significantly. This complexity is the central challenge that modern cloud observability tools are designed to solve.
This comprehensive cloud observability tools comparison is designed for technical decision-makers, platform engineers, and DevOps leaders. We will delve into the features, strengths, and ideal use cases of the top observability platforms on the market in 2025, providing a clear guide on how to choose the best cloud observability tools to maximize your ROI and drive true operational excellence.
Observability vs Monitoring: What Leading Enterprises Need to Know
The conversation often starts with cloud monitoring tools, but today’s leading enterprises operate on a fundamentally different concept: a unified observability platform. The distinction between observability and monitoring tools is crucial for anyone modernizing an IT estate:
1. Monitoring (The "Known Unknowns"): Traditional cloud monitoring tools inform you if a system is functioning correctly (e.g., CPU utilization is high, a server is down). They rely on pre-configured dashboards and alerts to anticipate potential problems.
2. Observability (The "Unknown Unknowns"): True cloud observability tools allow you to ask why the system is behaving a certain way—even for failures you’ve never encountered before. Observability is a property of the system itself, achieved by ingesting and correlating all three types of telemetry data analysis:
- Metrics: Time-series data (e.g., CPU load, request count).
- Logs: Discrete, timestamped records of events.
- Traces: End-to-end paths of a request across distributed services (distributed tracing in observability).
The best observability tools for cloud monitoring bring these three signals together on a unified observability dashboard. This unification enables advanced features such as AI-powered root cause analysis tools and anomaly detection in observability, allowing teams to transition from reactive firefighting to a proactive, predictive state. This unified approach is crucial for managing the complexity of microservices observability and container observability tools in a Kubernetes-driven environment.
Top Cloud Observability Tools: Overview and Comparison
The market for the best cloud observability tools is dominated by powerful, feature-rich vendors, alongside increasingly capable open-source suites. The following comparison breaks down the key players, their value proposition, and their ideal customer profile for 2025.

1. Datadog: The Full-Stack Powerhouse with Massive Integration
Datadog has established itself as the premier unified observability platform for its breadth and ease of integration. It is often the first choice for organizations undergoing legacy system modernization due to its expansive DevOps monitoring agent that supports over 800 technologies, including mainframes and serverless functions.
| Feature Highlight | Strategic Value |
| Unified Agent & Integrations | Collects metrics, logs, and traces from virtually any source—crucial for hybrid cloud observability solutions spanning legacy and Cloud Native Observability Tools. |
| Watchdog AI | Automatically correlates performance data, detects outliers, and provides AI-powered incident explanations, functioning as an AI-powered root cause analysis tool. |
| Security & APM Integration | Seamless integration of application performance with security monitoring and cloud cost management. |
| Container & Kubernetes Observability Tools | Best-in-class out-of-the-box dashboards and tooling for Docker observability tools and Kubernetes. |
- Pros: Unmatched integration library, superb user experience, powerful AI-driven observability tools for anomaly detection.
- Cons: The most expensive option; high data ingestion rates require strict data governance to manage costs effectively.
- Best For: Large, high-growth enterprises and mid-market companies that require a single, consolidated platform for a complex mix of Cloud Managed Services (AWS, Azure, GCP) and on-premises infrastructure.
2. Dynatrace: The Autonomous AI-First Platform
Dynatrace differentiates itself with its unique, proprietary Davis® AI engine, which goes beyond simple anomaly detection to deliver deterministic, automated root cause analysis. Its Smartscape technology automatically discovers and maps all services and dependencies in real-time, making it an exceptional tool for dynamic, high-change environments.
| Feature Highlight | Strategic Value |
| Davis AI Engine | Provides precise, automated root cause analysis, not just correlation, significantly reducing MTTR. |
| Smartscape | IT Service Dependency Mapping Tools that visualize the entire topology of modern microservices and traditional environments, vital for complex hybrid cloud observability solutions. |
| Code-Level Visibility | Automatically instrument applications for deep APM monitoring tool insights without code changes. |
| Full Multi-cloud Support | Excellent observability tools for AWS, Azure, GCP, and on-premises deployments. |
- Pros: Deep, autonomous AI and automation, strong focus on real user monitoring, explicitly built for complex cloud-native and Kubernetes observability tools.
- Cons: Premium pricing and the AI-first approach can have a steeper initial learning curve for non-technical users.
- Best For: Large enterprises, financial institutions, and organizations running mission-critical applications where automation, minimal alert noise, and the fastest possible MTTR are paramount.
3. New Relic: The Developer-Centric, Open Platform
New Relic transformed its business model to focus on being an OpenTelemetry-native and developer-focused cloud observability tool. Its straightforward, usage-based pricing model (billing by user type and data ingestion) appeals to DevOps teams looking for deep technical insights across the entire stack.
| Feature Highlight | Strategic Value |
| OpenTelemetry (OTel) Native | Deep, native support for open standards, minimizing vendor lock-in, and simplifying distributed tracing in observability. |
| NRDB (New Relic Database) | Allows engineers to query all telemetry data (metrics, logs, and traces) with a single query language (NRQL), facilitating rapid analysis of telemetry data. |
| Applied Intelligence (AIOps) | Provides automated alerting, correlation, and anomaly detection to reduce alert fatigue for DevOps teams. |
| Generous Free Tier | A low barrier to entry enables smaller teams and individual developers to leverage a fully featured, unified observability platform. |
- Pros: Excellent APM monitoring tool capabilities, strong support for log management and APM integration, and transparent, usage-based pricing.
- Cons: Per-user costs can scale rapidly in large, engineering-heavy organizations.
- Best For: DevOps teams, cloud-native startups, and mid-market companies who value OTel compatibility, transparent pricing, and deep code-level visibility.
4. Splunk Observability Cloud: The Scale and Analytics Leader
Splunk, traditionally known for its powerful log analytics and SIEM capabilities, has built its Splunk Observability Cloud into a unified suite that excels at ingesting, querying, and correlating massive volumes of data. It is the go-to platform for organizations with incredibly high ingest rates and stringent security and compliance needs.
| Feature Highlight | Strategic Value |
| Massive Scale & Analytics | Unmatched capability for high-volume data ingestion and complex, analytical queries for telemetry data analysis. |
| Full-Fidelity Distributed Tracing | Powered by acquired technology, it offers best-in-class distributed tracing in observability, enabling the tracking of every transaction. |
| Security and Observability Unification | Seamless integration with Splunk Enterprise Security makes it powerful for both SecOps and DevOps teams. |
| Multicloud Observability | Proven at the most enormous scale across every central public cloud and hybrid environments. |
- Pros: Industry-leading scale and analytics, powerful observability data correlation tools, and strong security integration.
- Cons: Higher Total Cost of Ownership (TCO) compared to competitors; complexity and operational overhead for smaller teams.
- Best For: Global enterprises, highly regulated industries, and organizations requiring the absolute highest level of data scale, query complexity, and integration between observability and security.
5. AppDynamics (Cisco): Business-Centric APM
AppDynamics maintains a strong focus on business context, making it a powerful best APM monitoring tool for line-of-business owners and IT leadership. Its strength lies in automatically connecting application performance issues directly to their financial or customer impact, facilitating more transparent communication between IT and the business.
- Pros: Deep transaction profiling, strong focus on business performance metrics and SLAs, excellent for modernizing complex legacy systems.
- Cons: Can be more traditional in its approach compared to cloud-native competitors, sometimes requiring more manual configuration for Kubernetes.
- Best For: Enterprises focused on business outcomes, large monolithic applications, and environments where IT service dependency mapping tools are critical for C-suite reporting.
6. Grafana Cloud: The Open Source Visualizer
Grafana Cloud offers a hosted, managed experience for the industry-standard open-source stack, comprising Grafana (for visualization), Prometheus (for metrics), Loki (for logs), and Tempo (for traces). It offers the flexibility of open source with the convenience and scalability of a cloud-managed service.
- Pros: Highly flexible, no vendor lock-in, excellent for teams already using open source, and the go-to standard for Prometheus and Kubernetes observability tools.
- Cons: Advanced features or vendor support require paid tiers; may lack the deep, proprietary AI of commercial alternatives.
- Best For: Teams committed to open-source standards, those running multi-cloud with a desire for a single pane of glass, and organizations looking for the best open source observability tools with a managed path.
7. Elastic Observability (ELK/ELK+): Search and Log Dominance
Evolving from the popular ELK Stack (Elasticsearch, Logstash, Kibana), Elastic Observability provides a powerful, search-based platform for metrics, logs, and traces monitoring. It excels at petabyte-scale log management and analytics, often a primary component in enterprise SIEM and analytics strategies.
- Pros: World-class log search and analytics, scalable architecture, strong SIEM integration, open by design with OpenTelemetry support.
- Cons: Can be resource-intensive and complex to self-manage at scale; advanced AI features often sit behind higher-cost subscription tiers.
- Best For: Organizations with massive log volumes and a need for robust search/SIEM correlation, and those who prioritize having a flexible stack over a purely integrated SaaS experience.
8. Chronosphere: The Metrics-at-Scale Specialist
Born from Uber's internal monitoring system (M3), Chronosphere focuses on solving the high-cardinality and cost problems associated with large-scale, cloud-native metrics. It provides sophisticated telemetry data analysis and data shaping tools that enable customers to control costs by intelligently sampling and dropping less critical data before ingestion.
- Pros: Elite cost control for metrics, designed for extreme scale, exceptional anomaly detection in observability for high-cardinality data.
- Cons: Highly specialized and premium-priced; logs and traces capabilities are strong, but the primary focus is metrics.
- Best For: Hyper-scale enterprises, advanced SaaS providers, and organizations running massive Kubernetes fleets who are struggling with uncontrollable metrics costs from incumbent vendors.
9. CloudZero: The FinOps-First Observability Platform
CloudZero takes a unique, cost-first approach to observability. It maps cloud spend directly to business metrics, microservices, and features, providing granular insights into the cost of cloud observability tools alongside performance data. This is crucial for FinOps initiatives and cloud cost optimization.
- Pros: Provides actionable, engineer-friendly cost analysis; excellent for multi-cloud observability platforms focusing on spend optimization.
- Cons: Focuses primarily on cost and infrastructure monitoring, rather than serving as a full-stack APM replacement like Datadog or New Relic.
- Best For: Finance and engineering leadership teams driving FinOps, and organizations seeking to measure the ROI of cloud observability tools by linking performance to specific spending drivers across AWS, Azure, and GCP.
10. Prometheus: The Cloud-Native Foundation
Prometheus remains the uncontested open-source champion for collecting time-series metrics. It is the foundational technology for nearly all Kubernetes observability tools and a core pillar of the cloud-native ecosystem. It is almost always paired with Grafana for visualization.
- Pros: Free, open, fantastic with containers/Kubernetes, and its query language (PromQL) is the industry standard for metrics.
- Cons: Limited native support for traces and logs; requires significant expertise to operate at enterprise scale, especially for high availability and long-term storage.
- Best For: DevOps teams with strong SRE expertise, companies committed to an open-source toolchain, and environments where container observability tools are the primary focus.
Feature and Platform Comparison Table
This table provides a snapshot of key features essential for comparing strategic cloud observability platforms.
| Platform | AI/ML Analytics | Cloud Support | Container Observability | Best for |
| Datadog | Watchdog AI (RCA) | AWS/Azure/GCP/Hybrid | Excellent, Best-in-Class | Enterprise/Scale & Cloud Managed Services |
| Dynatrace | Davis AI (Autonomous RCA) | Hybrid/Multi-cloud | Elite, Auto-discovery | Large enterprises, Automated Ops |
| New Relic | Applied Intelligence | AWS/Azure/GCP | Strong, OTel-Native | DevOps Teams, Open Standards |
| Splunk | ITSI/MLTK (Scale) | AWS/Azure/GCP/Hybrid | Leading, High Ingest | High-Scale/High-Security Analytics |
| AppDynamics | Yes (Business IQ) | All major | Good, APM-Focused | Business Monitoring, Monoliths |
| Grafana Cloud | Community-AI (via Plugins) | All/Integrations | Excellent (Prometheus/Loki) | OSS Enthusiasts, Custom Needs |
| Elastic | X-Pack ML | All/Integrations | Good, Log-centric | Log Management, SIEM Integration |
| Chronosphere | Yes (Metrics-focused) | Cloud-Native | Elite, Metrics Control | Hyper-Scale, Cost Optimization |
| CloudZero | Focused on Cost Analysis | Multi-cloud | Moderate (via Integrations) | FinOps/Cloud Spend Optimization |
| Prometheus | No (Rules-based) | All via Exporters | Best-in-class Metrics | Kubernetes Observability Tools |
Native Cloud Monitoring Tools: AWS, Azure, and GCP
While market leaders offer deep multi-cloud support, the native monitoring tools from hyperscalers remain essential for maintaining the health of core infrastructure. They are the initial source of telemetry, making them crucial for the foundation of any multicloud observability platform.
- AWS CloudWatch: Provides deep, real-time telemetry across all AWS services. It's the go-to for real-time cloud performance monitoring of AWS infrastructure and offers basic anomaly detection.
- Azure Monitor: A unified platform for Azure logs, metrics, and security. It offers native analytics, alerts, and deep integration with Azure services and can be extended to hybrid environments.
- Google Cloud Operations (Stackdriver): The native metric, log, and tracing solution for GCP, now tightly integrated with managed Prometheus and OpenTelemetry standards.
Cloud observability best practices recommend leveraging native tools for core infrastructure and then feeding their data into a centralized, unified observability platform (such as Datadog, Splunk, or New Relic) to achieve true multi-cloud, end-to-end visibility and telemetry data correlation.
Trends: AI-Driven Observability Tools and Cloud Native Future
The trajectory of the best cloud observability tools in 2025 is defined by two key forces: AI and Open Standards.
The Rise of AI-Driven Observability Tools
The shift from simple anomaly detection in observability to complete AI-powered root cause analysis tools is a game-changer.
- Proactive Remediation: Platforms like Dynatrace and Datadog utilize AI to automatically correlate signals (metrics, logs, traces) and even business KPIs, identifying subtle deviations that human operators might miss. This move transforms hybrid cloud observability solutions from reactive alerting systems into predictive remediation engines.
- Intelligent Cost Control: AI is being used in platforms like Chronosphere and CloudZero to analyze the value of telemetry data, automatically prioritizing high-value data and suppressing or sampling "noisy" low-value data before ingestion, delivering real-time cost optimization of cloud observability tools.
Open Standards and the Unified Observability Platform
The proliferation of cloud-native observability tools—such as Kubernetes, microservices, and serverless—has driven the industry toward open standards.
- OpenTelemetry (OTel): This framework is now the default for instrumenting applications, providing a vendor-neutral way to collect metrics, logs, and traces monitoring data. Tools that are OTel-native, like New Relic, Dash0, and Elastic, minimize the risk of vendor lock-in and simplify distributed tracing in observability across complex environments.
- Unified Dashboards: DevOps teams are consolidating their efforts to streamline their operations. The average number of monitoring tools is decreasing as enterprises recognize that siloed data hinders troubleshooting. The future is a single, AI-backed unified observability dashboard for all environments—cloud, on-premises, and containerized. This consolidation is a core factor in the ROI of cloud observability tools.
Benefits and ROI of Cloud Observability Tools
For US and Canadian enterprises, the investment in a top cloud observability platform yields quantifiable business value across operations, finance, and security. The benefits of cloud observability tools directly impact the bottom line:
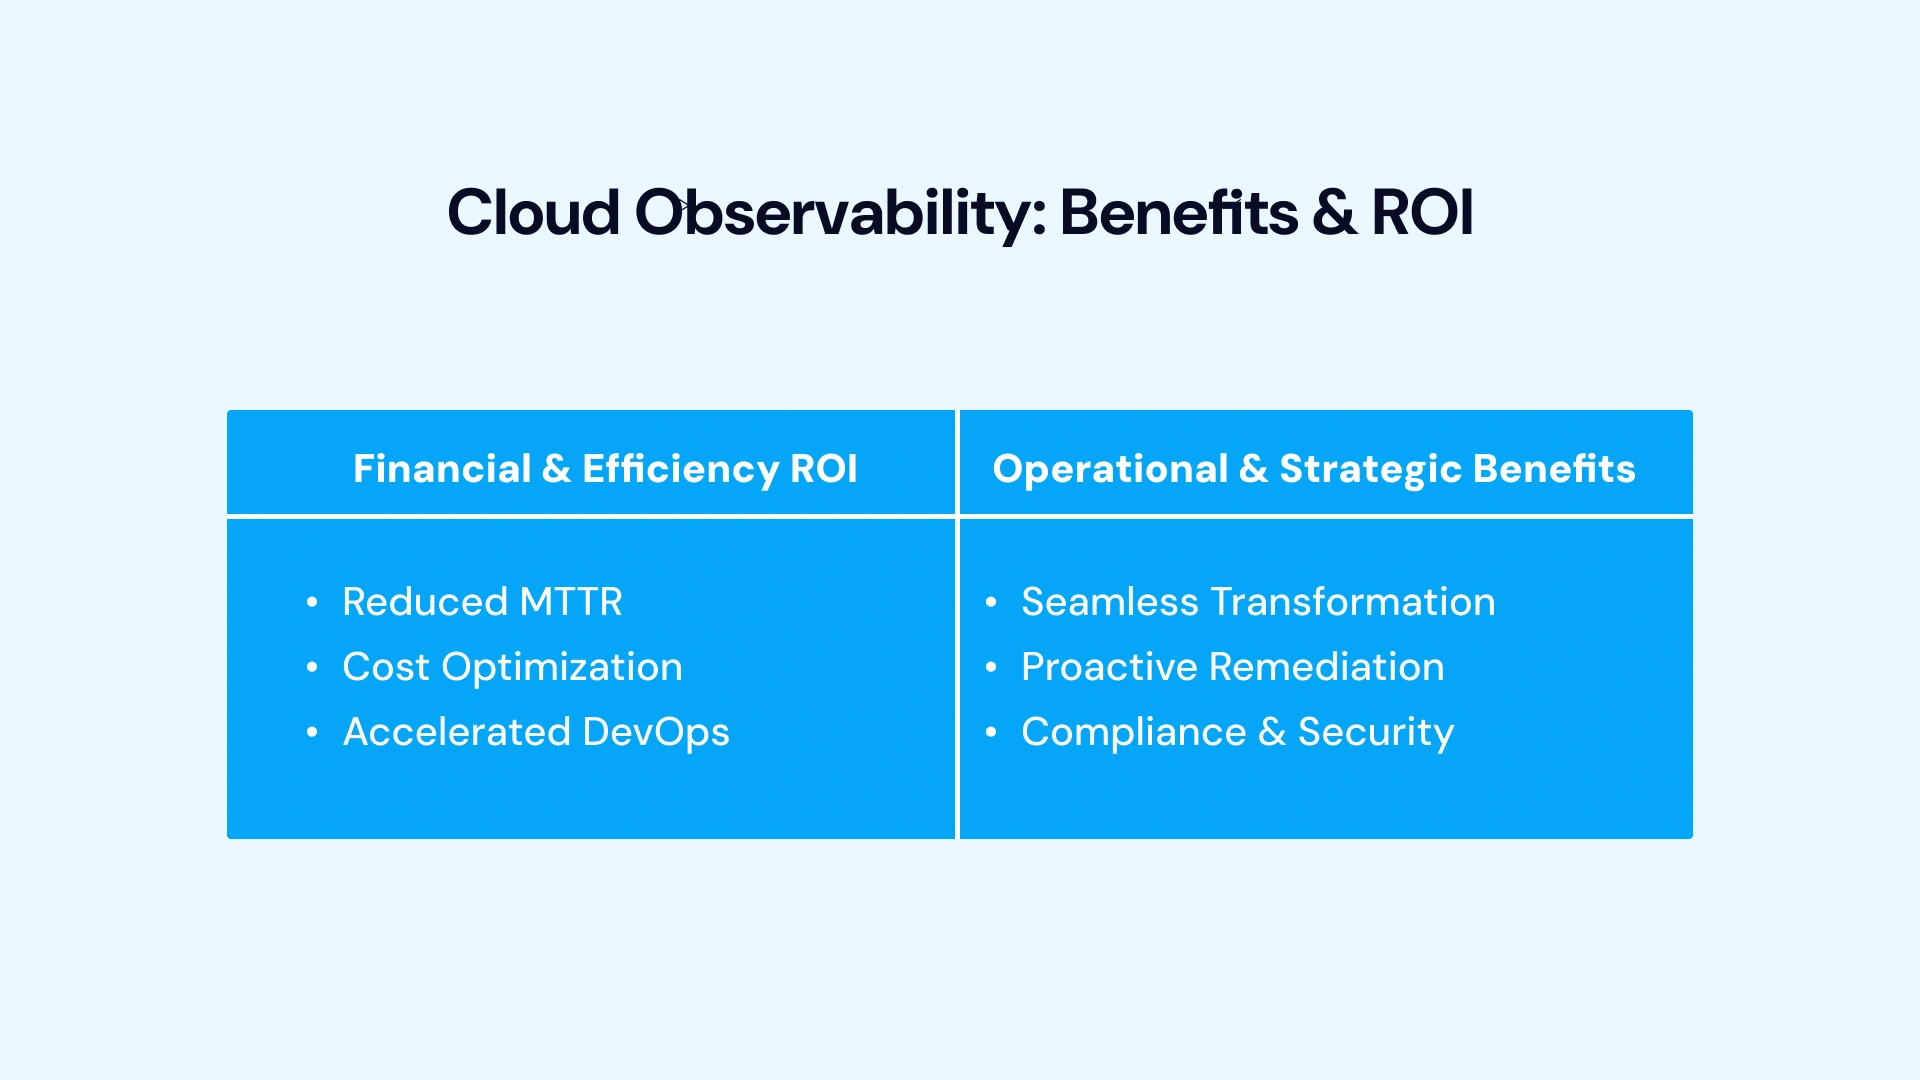
Financial & Efficiency ROI:
- Reduced MTTR: AI-powered root cause analysis cuts the time to diagnose and fix issues by up to 35%, directly minimizing the cost of unplanned downtime.
- Cost Optimization: Tools like CloudZero provide granular visibility into cloud spending, enabling efficient resource utilization and reducing the cost of cloud observability tools and infrastructure expenses.
- Accelerated DevOps: Observability for DevOps teams with unified telemetry data correlation tools streamlines pipelines, accelerating the delivery of new features.
Operational & Strategic Benefits:
- Seamless Transformation: Provides the necessary visibility for successful legacy system modernization services, observability, and migration to Cloud Managed Services.
- Proactive Remediation: Anomaly detection in observability enables teams to address issues before they impact customers, thereby improving the user experience and protecting the brand reputation.
- Compliance & Security: Centralized log management and APM integration help meet regulatory and security requirements by providing an immutable record of system behavior and security events.
Best Practices for High-Impact Cloud Observability
Choosing the best cloud observability tools is only the first step. Maximizing their value requires a strategic adoption plan rooted in cloud observability best practices:

1. Prioritize Unified Telemetry: Insist on a unified observability platform that natively correlates metrics logs, and traces monitoring.Avoid platforms that treat these as separate, siloed products.
2. Adopt OpenTelemetry (OTel): Standardize your application instrumentation on OTel to ensure portability and prevent future vendor lock-in. This is crucial for cloud native observability tools and microservices.
3. Embrace AI for Triage: Select tools with sophisticated AI-driven observability tools to manage alert noise. The goal is not just to collect more data, but to receive fewer, more meaningful alerts that include the probable root cause.
4. Integrate FinOps: Select solutions that offer real-time cost transparency (such as CloudZero or similar features on major platforms) to enable engineers to write more cost-efficient code and optimize resources.
5. Focus on Business Impact: Configure dashboards and alerts around business-critical metrics (e.g., checkout latency, successful logins) rather than purely technical metrics (e.g., CPU load) to quantify the benefits of cloud observability tools for the C-suite.
6. Enable Auto-Discovery: Leverage platform capabilities to auto-discover cloud dependencies and IT service dependency mapping tools, continuously mapping your constantly changing microservices and container environments.

Choose VLink's Cloud Managed Services for Your Success
Selecting the best cloud observability tools—be it Datadog, Dynatrace, or an open-source stack—is a complex decision, but successful implementation is the greater challenge. For US and Canadian enterprises, achieving the full ROI of cloud observability tools requires a strategic partner capable of integrating these platforms seamlessly with existing legacy system modernization and observability initiatives, as well as dynamic cloud-managed services.
VLink specializes in bridging this gap. We don't just sell software; we deliver unified observability platform solutions, expertly managed and tailored to your unique business context. Our team of DevOps experts and certified cloud engineers acts as an extension of your organization, ensuring you maximize the value of your chosen tools while maintaining focus on core business innovation.
How VLink Drives Your Observability ROI:
- Platform Implementation & Integration: We provide end-to-end services, from detailed cloud observability platform comparison to hands-on deployment. We ensure your new cloud observability tools are correctly configured for auto-discovery of cloud dependencies and distributed tracing in observability, providing full-stack visibility across AWS, Azure, GCP, and on-premises environments.
- AI-Powered AIOps and RCA: VLink leverages the advanced capabilities of the AI-driven observability tools to create proactive operations models. We tune anomaly detection in observability and configure AI-powered root cause analysis tools to drastically reduce alert noise and cut your MTTR, transforming raw data into actionable, real-time cloud performance monitoring insights.
- Hybrid & Legacy System Modernization: Our expertise in legacy system modernization and observability allows us to seamlessly onboard older applications into your unified observability dashboard. We design hybrid cloud observability solutions that ensure every component—from mainframes to microservices—contributes to the central metrics logs, and traces monitoring strategy.
- DevOps Acceleration and FinOps: We embed observability directly into your CI/CD pipelines, providing essential log management and APM integration that empowers your developers. Furthermore, VLink helps you implement cloud observability best practices for FinOps, using data to drive cloud resource efficiency and control the cost of cloud observability tools.
By choosing VLink’s Cloud Managed Services, you gain over 18 years of global IT expertise, a dedicated team of 600+ certified technology professionals, and a partner committed to engineering powerful digital experiences that drive your success, accelerate time-to-market, and strengthen your competitive edge.
Conclusion
In 2025, cloud observability is the operating system for the modern enterprise. The choice of a platform—whether it's Datadog vs Dynatrace vs New Relic vs Splunk—depends on your specific balance of scale, budget, expertise, and operational complexity.
- If full-stack scale and breadth are your priority, Datadog remains a powerful choice.
- If autonomous AI and automated root cause analysis are non-negotiable for critical workloads, Dynatrace is the leader.
- If the developer focuses on transparent pricing and OpenTelemetry, New Relic offers a compelling platform.
- If your challenge is cost and FinOps visibility at scale, look to CloudZero.
- If you seek maximum flexibility with open standards for Kubernetes observability tools, the Grafana/Prometheus/Elastic stack is a formidable choice.
By carefully evaluating the cloud observability tools comparison presented here, your organization can select the ideal unified observability platform to master cloud-managed services, accelerate the modernization of legacy systems, and achieve unparalleled digital resilience in the North American market.
Ready to cut through the complexity and deploy the right observability strategy? Our experts specialize in detailed cloud observability platform comparison and strategic implementation across AWS, Azure, and GCP. Contact us today to secure your cloud operations and maximize your cloud ROI.

Vice President, Strategy – VLink Inc.
Sambhavi Gopalakrishnan is the Vice President of Strategy at VLink Inc., bringing over a decade of experience in IT leadership, project implementation, and strategic growth. She possesses a strong foundation in technical project management and pre-sales, driving innovation and business transformation at VLink.

 Shivisha Patel