





Sooner or later, every team running production workloads on Azure faces the same question: keep operations in-house, hand them to a partner, or split the job? The debate usually starts with a gut feeling ("we can do it cheaper ourselves") or a sales deck ("we'll save you 30%"). Neither is a model, and Azure managed services deserve the same scrutiny as any other major spending decision.
This guide builds the model. Below is a transparent, three-year total cost of ownership (TCO) comparison of Azure Ops vs. Managed Services, with every assumption stated so you can swap in your own numbers. You'll also see where each approach tends to win, what the spreadsheet can't capture (risk, coverage, and opportunity cost), and how to decide without relying on anyone's marketing.

What We Mean by Azure Ops vs Managed Services
Most comparisons are lopsided before they begin. Internal teams often compare a provider's fee against the cost of "one engineer," forgetting nights, weekends, vacations, attrition, and specialized tooling. On the flip side, providers compare their fees against a deliberately inflated in-house headcount model.
Both miss the exact same factors: the true financial cost of an operational outage, the value of guaranteed response SLAs, and the long-term savings generated by active FinOps and cloud governance.
The goal here is a fair fight. To evaluate options accurately, we will define the three core operating models, set explicit financial and operational assumptions, run the three-year numbers, stress-test them, and candidly examine the qualitative factors that don't fit in a spreadsheet cell.
Model A: In-House Azure Operations
Your internal cloud operations team handles monitoring, patching, backup verification, security response, governance, cost reviews, and support. You hire, train, and retain the staff, license the required tooling, and own every operational outcome.
Model B: Fully Managed Azure Services
The most common form of outsourced cloud operations. An Azure Managed Service Provider (MSP) operates the environment under a strict Service Level Agreement (SLA). Scope typically includes 24x7 monitoring, incident response, security operations, backup/DR management, governance, and cost optimization. You maintain a lean internal lead—usually a cloud architect or platform director—to guide strategy and approve changes.
Model C: Hybrid (Co-Managed)
In a hybrid design, your internal dedicated team stays small and focused on high-value architecture, product integrations, and application-level decisions. The external partner acts as an operational multiplier by handling 24x7 monitoring, threat detection, and routine infrastructure management. For most mid-market companies, this co-managed approach offers the practical middle ground between control and coverage.
The Assumptions Behind the Model
Every TCO is only as honest as its assumptions. Here are ours. Change them freely.
Assumption | Value |
| Azure consumption (Year 1) | $600,000 per year |
| Consumption growth | 10% per year (Y2: $660,000; Y3: $726,000) before optimization |
| Environment | Roughly 150 resources across production and non-production, with databases, networking, and several customer-facing apps |
| Fully loaded cost per Azure engineer | $165,000 per year, rising 4% annually |
| Model A team | 3 engineers (business hours plus on-call; not true 24x7) |
| Model A other costs | $120,000/yr for tooling, training and certification, and turnover/recruiting |
| Model B provider fee | $200,000 in Year 1, rising to $210,000 and $220,000 |
| Model B internal owner | 1 engineer at the same loaded cost |
| Model B onboarding | $40,000 one-time in Year 1 |
| Model C internal team | 2 engineers |
| Model C provider fee | $110,000, $114,000, $118,000 (24x7 monitoring and security scope) |
| Model C other costs | $50,000 in Year 1 (tools and onboarding), $30,000 per year after |
| Optimization savings on consumption | A: 4% / 8% / 8%; B: 9% / 18% / 18%; C: 6% / 12% / 12% |
Two notes on fairness. First, we deliberately gave Model A a three-person team rather than the larger group a true 24x7 rotation would require, which flatters the in-house option on cost while leaving a coverage gap. Second, the savings percentages are assumptions, not guarantees; we stress-test them below.
Important: The figures are an illustrative model built on stated assumptions, not a quote or a benchmark. Your salaries, Azure consumption, and provider pricing will differ. Use the structure, then plug in your own data.
The 3-Year TCO Comparison
All figures are in thousands of US dollars.
Operations Cost (People, Provider Fees, Tooling)
| Year 1 | Year 2 | Year 3 | 3-Year Total |
| A: In-house | 615 | 635 | 655 | 1,905 |
| B: Managed | 405 | 382 | 398 | 1,185 |
| C: Hybrid | 490 | 487 | 505 | 1,482
|
Azure Consumption After Optimization
| Year 1 | Year 2 | Year 3 | 3-Year Total |
| Baseline (no optimization) | 600 | 660 | 726 | 1,986 |
| A: In-house | 576 | 607 | 668 | 1,851 |
| B: Managed | 546 | 541 | 595 | 1,683 |
| C: Hybrid | 564 | 581 | 639 | 1,784 |
Total Three-Year TCO
Model | Operations | Consumption | Total TCO | vs. In-House |
| A: In-house | 1,905 | 1,851 | 3,756 | n/a |
| B: Managed | 1,185 | 1,683 | 2,868 | about 24% lower |
| C: Hybrid | 1,482 | 1,784 | 3,266 | about 13% lower |
In this scenario, managed services come out ahead by roughly $888,000 over three years. The gap comes from two places: about $720,000 of lower operations cost (fewer salaried hires, lower tooling and turnover costs) and about $168,000 of deeper consumption savings.
Stress-Testing the Result
A model that only works under favorable assumptions is a sales pitch. Here is how the totals move when we push on the weak points.
Scenario | Model A | Model B | Result |
| Base case | 3,756 | 2,868 | B lower by about 24% |
| Provider delivers only half the assumed savings | 3,756 | 3,019 | B lower by about 20% |
| Provider delivers no optimization savings at all | 3,891 (no savings) | 3,171 (no savings) | B lower by about 18% |
| In-house team matches the provider's 18% savings | 3,588 | 2,868 | B lower by about 20% |
The direction holds across all four scenarios because the gap is driven mainly by staffing, not by savings claims. That said, the model does flip in some real situations:
- Small estates. If your Azure consumption is a fraction of this example, a provider's fixed fees and minimums can outweigh the savings, and a single strong engineer may be cheaper.
- Deep, stable in-house expertise. A team that already has mature governance, automation, and on-call coverage is competing with the provider on its home turf.
- Specialized platforms. Heavily customized or niche workloads can make a provider's learning curve costly.
- Premium provider pricing. If a quote is far above the $200,000 used here for this scope, the gap narrows quickly.
What the Spreadsheet Can't Capture
While spreadsheets excel at tracking numbers, dates, and clear logical formulas, they struggle to quantify complex, human, and dynamic realities. Here is a breakdown of what spreadsheets inherently miss or fail to capture.
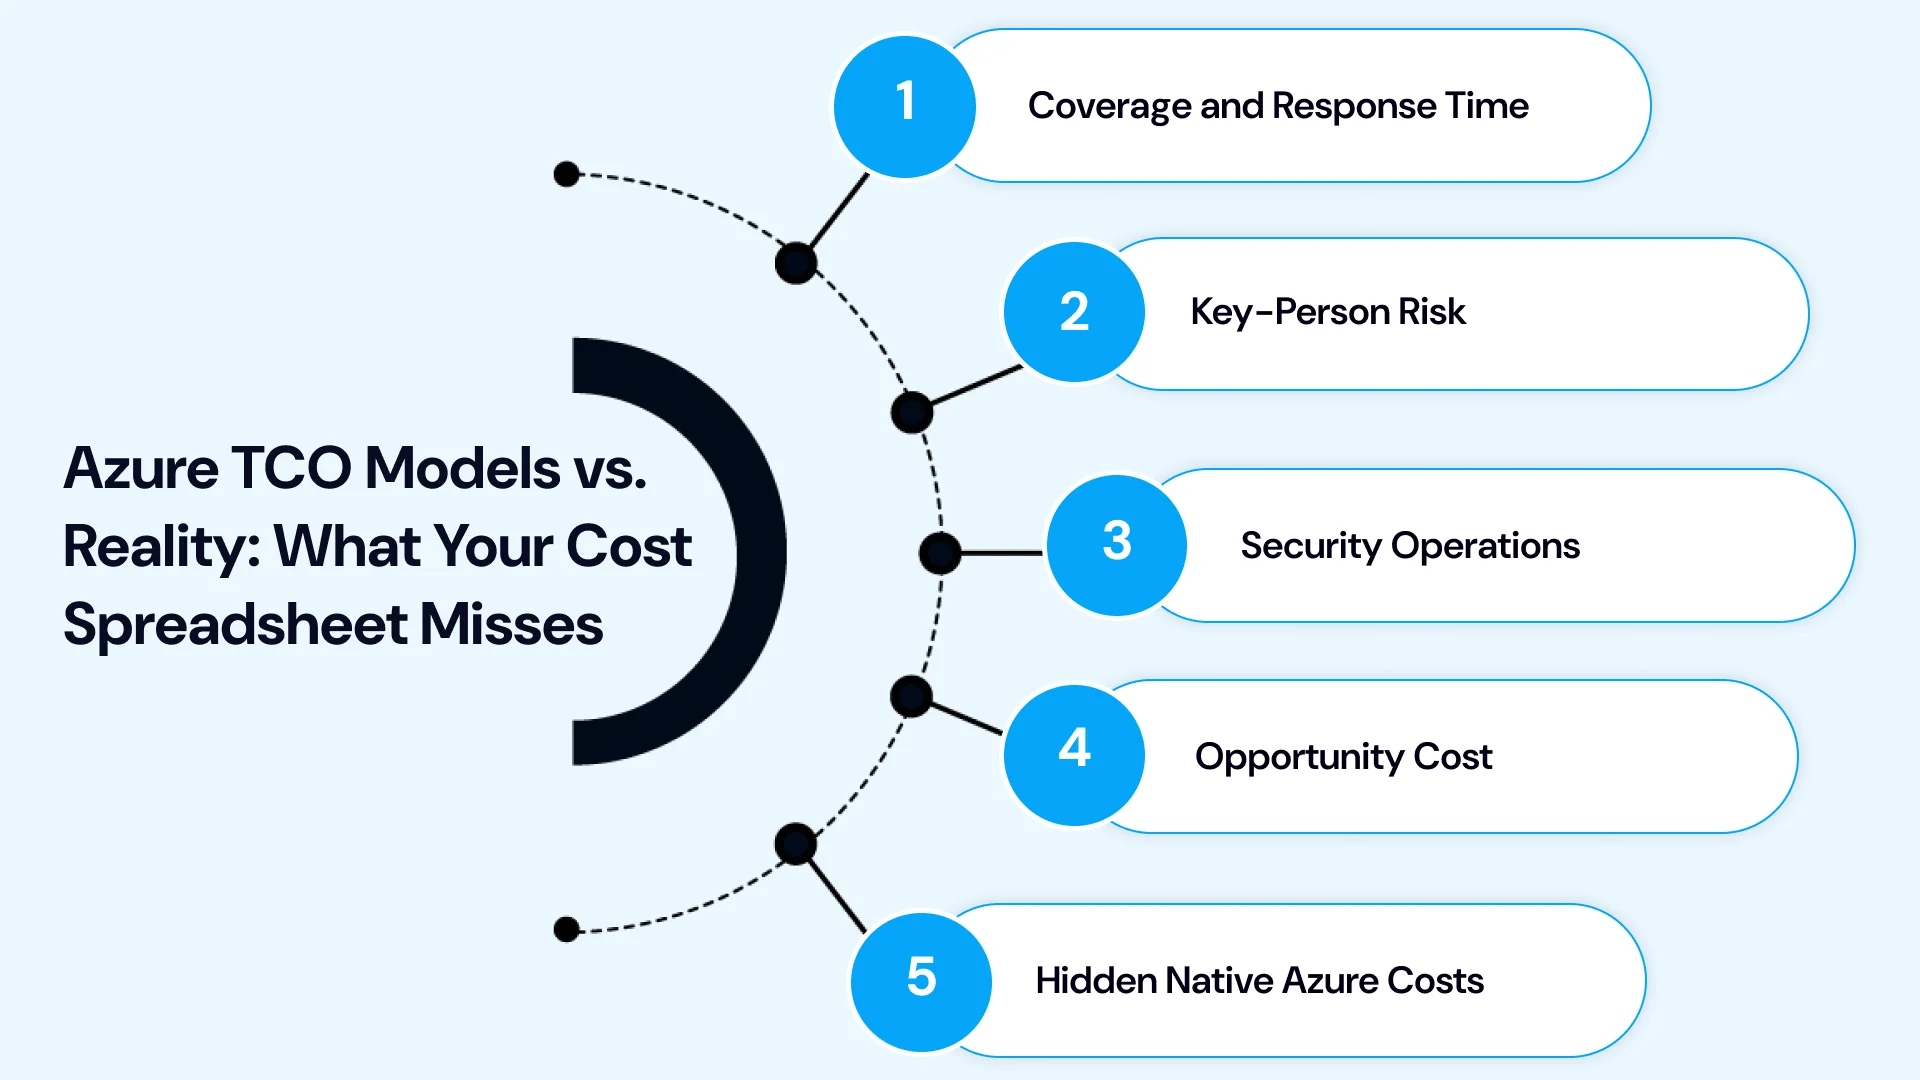
Coverage and Response Time
Model A as costed does not provide true 24x7 coverage. Adding it means more headcount or a paid on-call rotation, both of which raise costs. The cost of the coverage gap shows up when an incident hits at 2 a.m., and nobody is awake to see it.
Key-Person Risk
Identity and access management knowledge is a classic single point of failure because one engineer often holds all the privileged-access details. When one or two engineers hold the platform knowledge, a resignation is a business risk, not just an HR event. Providers spread knowledge across a team and document it as a matter of course. Internal teams often don't.
Security Operations
Following Azure security best practices is a continuous activity, not a one-time project, and it is where internal teams most often fall behind.
Strong Azure security best practices require continuous work: posture management, threat detection, patching, and incident response. Identity and access management in particular needs constant review, covering least privilege, conditional access, privileged access, and joiner-mover-leaver hygiene. Most small internal teams struggle to staff this properly alongside their delivery work. If you are weighing SIEM options, our comparison of Azure Sentinel vs. Splunk shows what to ask about tooling.
Opportunity Cost
Every hour an engineer spends patching or triaging alerts is an hour not spent building product. Many teams find that offloading routine operations is worth more in delivery speed than in direct savings, which is why this line rarely appears in a TCO but often decides the debate.
Hidden Native Azure Costs
Provider fees are separate from Azure consumption. Some services also carry their own tiers: for example, azure api management service tiers, premium databases, and support plans appear on the Microsoft bill regardless of who operates the environment. Make sure your model includes them under every scenario so the comparison stays like-for-like. The same applies to an azure api management service tier used for partner or mobile traffic, because its cost sits outside any provider's management fee, and to Azure-managed hosting fees where a provider also hosts workloads.
Where Each Model Wins
Selecting the right cloud management approach isn't about finding a one-size-fits-all solution; it’s about aligning your operational model with your internal capabilities, budget priorities, and long-term business goals. Whether you choose to manage your Azure footprint entirely in-house, fully outsource to a partner, or adopt a hybrid strategy, each framework excels under distinct organizational realities.
Choose In-House When
- Your Azure footprint is small and stable
- You already have a capable, well-staffed team with tested on-call coverage
- Compliance or contractual rules prevent external access to production
- Your workloads are highly specialized, and expertise is your differentiator
Choose Managed Services When
Broad Azure managed IT services engagements make the most sense when several of these apply:
- You need real 24x7 coverage without building a rotation
- Security operations and compliance evidence are a priority
- Cloud spend is growing faster than anyone can govern
- Your engineers are spending more time on operations than on product
Choose Hybrid When
- You have a strong platform or architecture team but not a round-the-clock one
- You want to retain control of design while outsourcing monitoring, security, and routine operations
- You want to move gradually and prove the provider's value before expanding scope
Understanding Azure Managed Services Pricing
Because Azure managed services pricing drives so much of the result, it pays to understand how providers charge. The three most common structures are a percentage of Azure spend, a per-resource or per-user fee, and a tiered retainer. Each shifts risk differently: percentage models grow with your consumption, per-resource models reward efficient architectures, and tiered retainers give the most predictable budgeting.
When you request quotes, insist on an itemized scope so that Azure managed services pricing from different vendors can be compared line by line. Ask what is included for 24x7 coverage, security operations, governance, and cost reporting, and what triggers extra fees. If you are comparing Azure managed hosting offerings against full operational management, be clear that hosting alone usually excludes the security, governance, and optimization work that produce much of the value.
Evaluating Azure Cloud Managed Service providers against each other is easier once scope is standardized. Providers and customers also use different names for similar services. You will see Azure managed IT services, Azure cloud managed service providers, and "Azure MSP" used almost interchangeably, so define scope on paper before comparing price.
How Managed Services Create the Savings in the Model
The optimization assumption is the most debated number in any Azure Ops vs Managed Services comparison, so it is worth showing where it comes from. Disciplined cloud cost optimization typically combines:
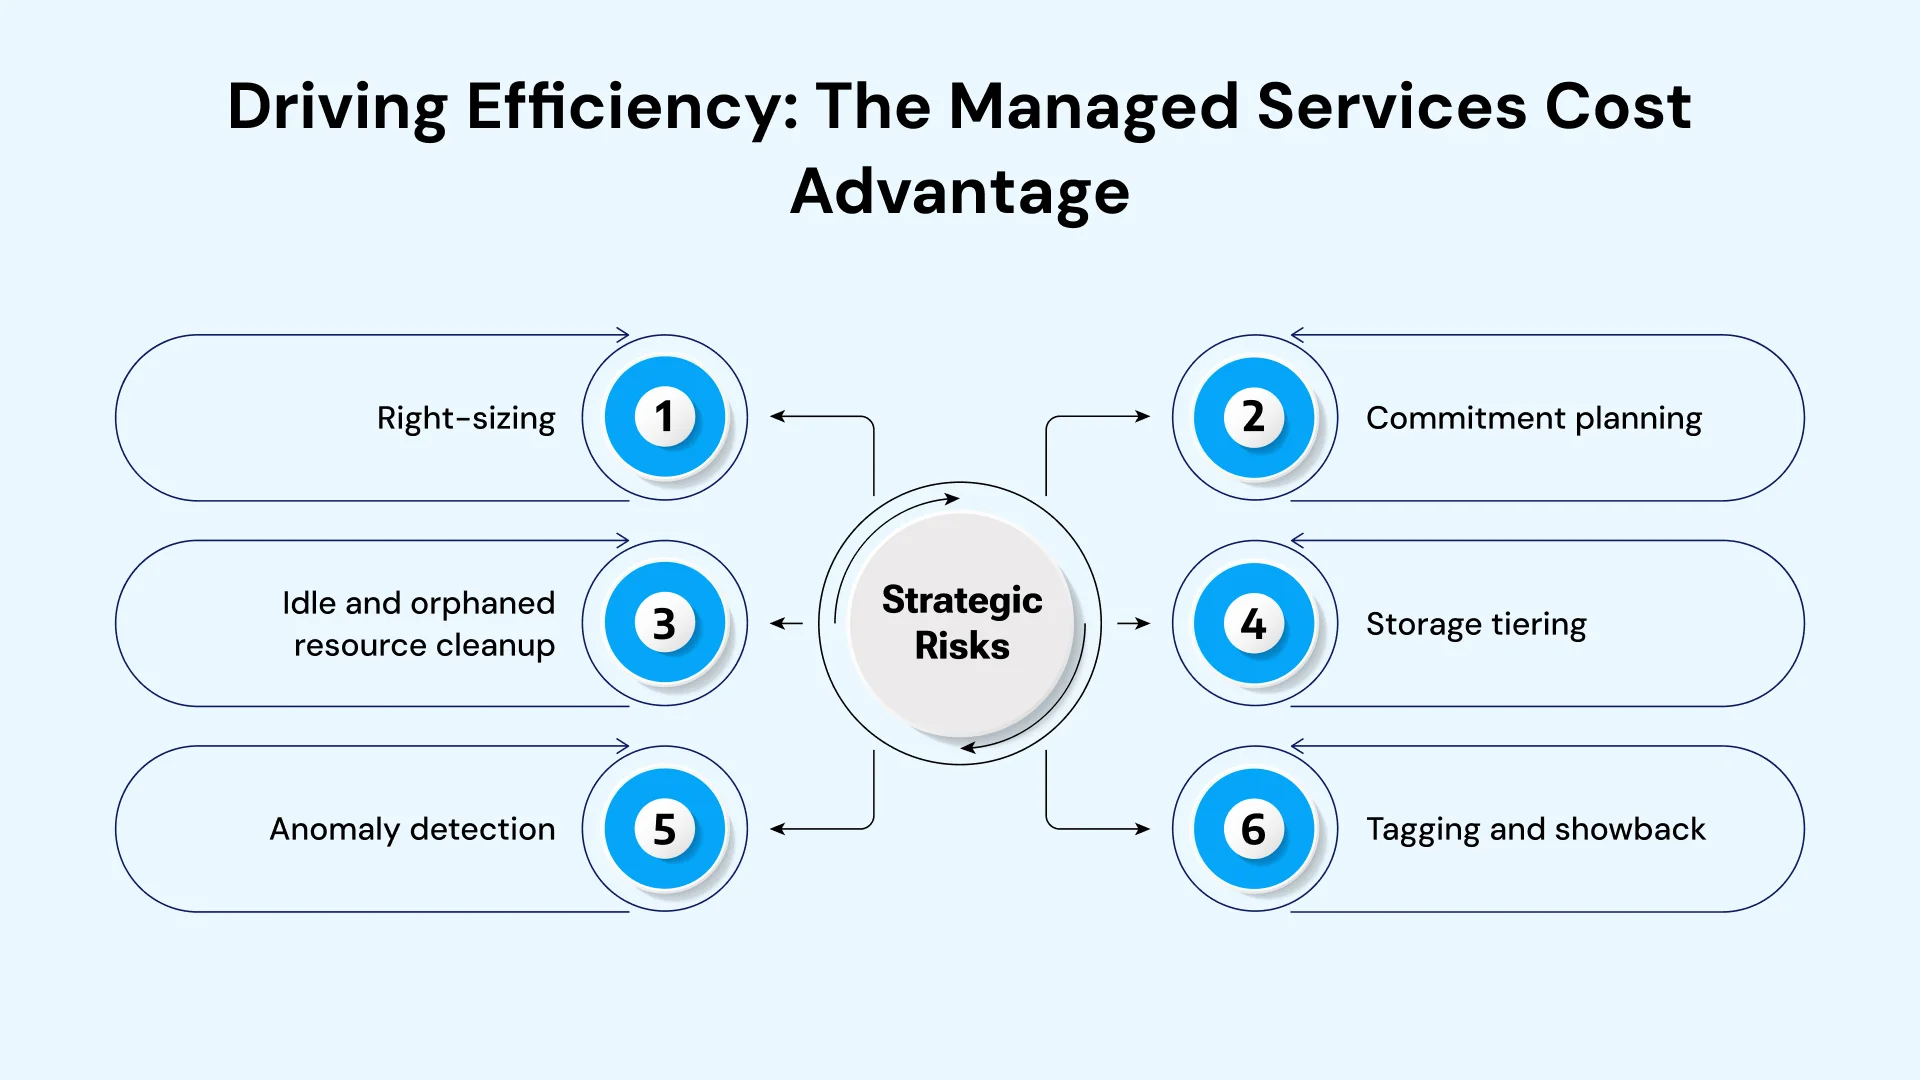
- Right-sizing over-provisioned compute and databases
- Commitment planning with reservations and savings plans for steady workloads
- Idle and orphaned resource cleanup, which tends to recur without continuous scanning
- Storage tiering and snapshot hygiene
- Anomaly detection that catches spikes in days rather than at month-end
- Tagging and showback so that spend has an owner
None of these require a provider. Each requires someone to own it every month. That ownership, not special technology, is the real advantage a dedicated operations function brings.
A Simple Decision Framework
To quickly determine which approach aligns with your organization, evaluate your priorities across this core decision framework.
- Measure your baseline. Document current Azure spend, headcount involved in operations, tools, and incident history.
- Define coverage needs. Decide whether you need true 24x7 response and what your recovery objectives are.
- Build the three-way model. Use the structure above with your own salaries, consumption, and quotes.
- Stress-test. Halve the savings, raise the provider fee 25%, add a departure to the in-house team, and see whether the answer changes.
- Pilot before committing. A 60- to 90-day pilot on one workload or subscription gives you real data on response times and reporting quality.
- Revisit annually. Your estate, team, and market rates change; so should the model.
Pro Tips:-
Operating model decisions are easier when they are made during the move rather than after it. If you are earlier in the journey, our Azure Migration tool guide covers assessment and tooling, and the Azure Cloud Migration services explain how landing zones, governance, and run-state ownership are planned from day one.
For organizations spanning multiple platforms, our broader Cloud Migration Services cover that scope, and you can see the approach applied in practice in this Case Study. To understand why teams choose the platform in the first place, read about the benefits of the MS Azure Cloud Platform.
Partner with Our Experts to Build Your Ideal Model
Whether Azure managed services fit you or not, the right answer to Azure Ops vs Managed Services is the one that fits your estate, your team, and your risk tolerance, and it should be proven with your own numbers. Our expert team helps mid-market and enterprise organizations across the US, Canada, and India build that evidence: we model your three-year TCO, run pilots, and operate Azure environments under clear SLAs with transparent monthly reporting.
If you want an independent view on architecture and operating-model choices before you commit, our Azure Consulting services team can review your environment, pressure-test your assumptions, and recommend a model without a pre-set answer.
Wrapping Up!
The Azure Ops vs Managed Services debate is best settled with a model, not a slogan. In our illustrative three-year comparison, managed services delivered the lowest TCO, hybrid sat in the middle, and a lean in-house team cost the most while offering the thinnest coverage. The ranking held under stress tests because staffing, not savings claims, drove most of the difference. It would flip for small estates, deeply expert internal teams, or unusually expensive provider quotes.
Run the numbers with your own data, include the costs that don't fit neatly in a spreadsheet, and pilot before you commit. The best operating model is the one you can defend with evidence a year from now.
Ready to find the right fit for your organization? Reach out to our team to run a custom TCO assessment using your real-world data and explore which Azure operating model will deliver the highest performance and efficiency for your business.

Vice President, Strategy – VLink Inc.
Sambhavi Gopalakrishnan is the Vice President of Strategy at VLink Inc., bringing over a decade of experience in IT leadership, project implementation, and strategic growth. She possesses a strong foundation in technical project management and pre-sales, driving innovation and business transformation at VLink.

 Shivisha Patel